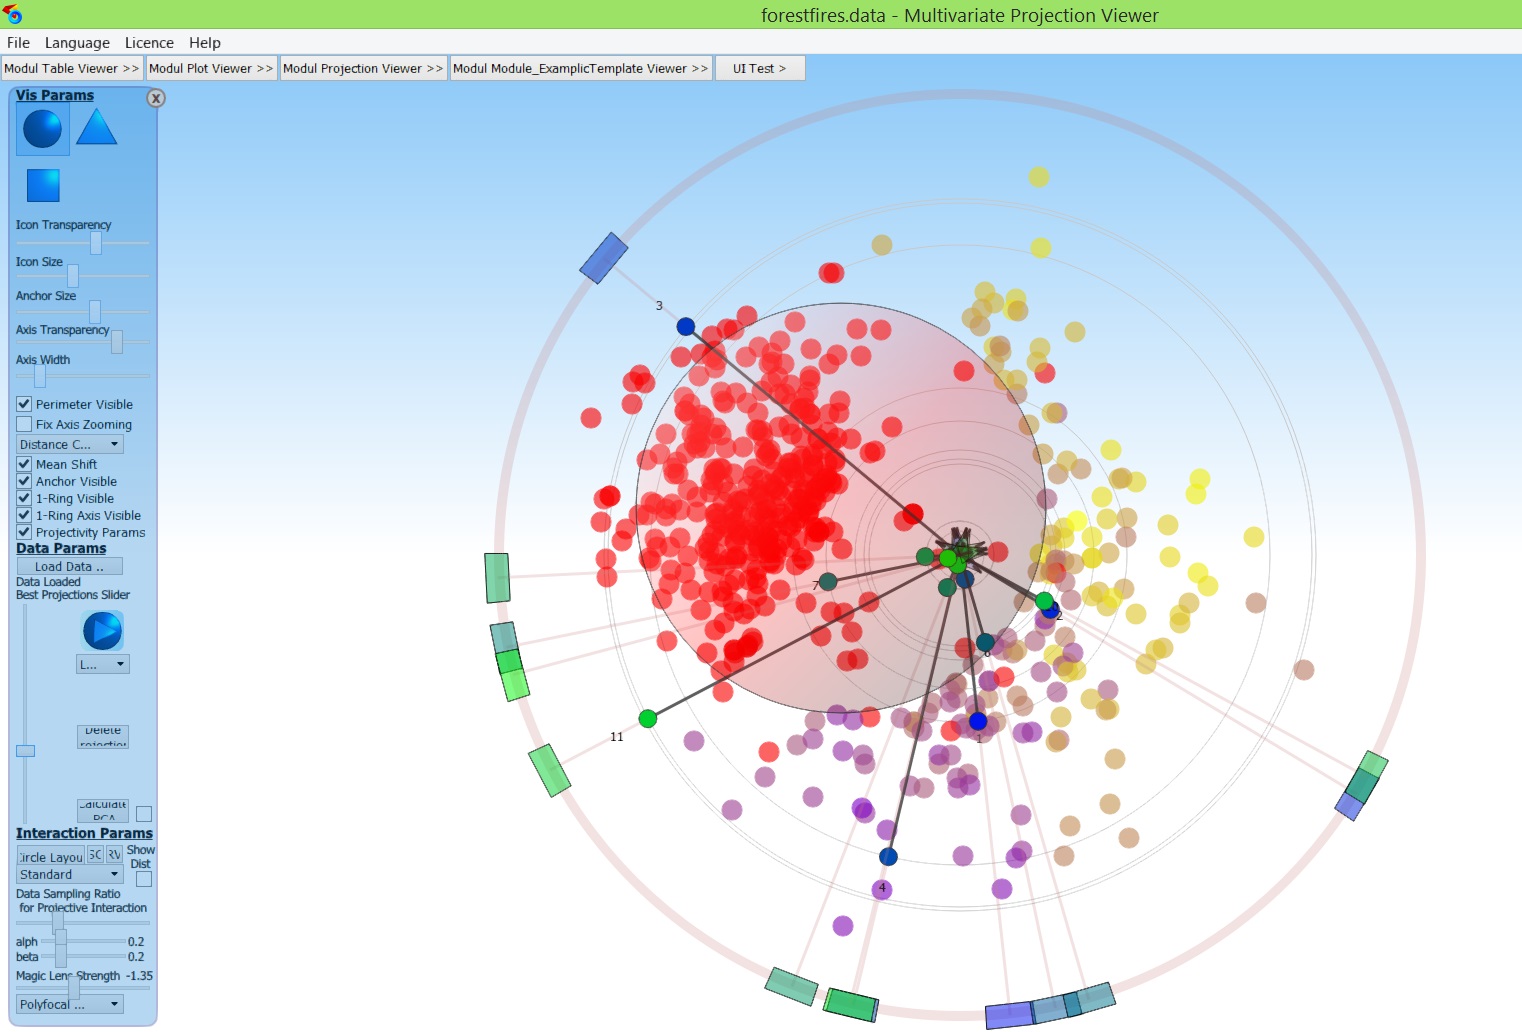
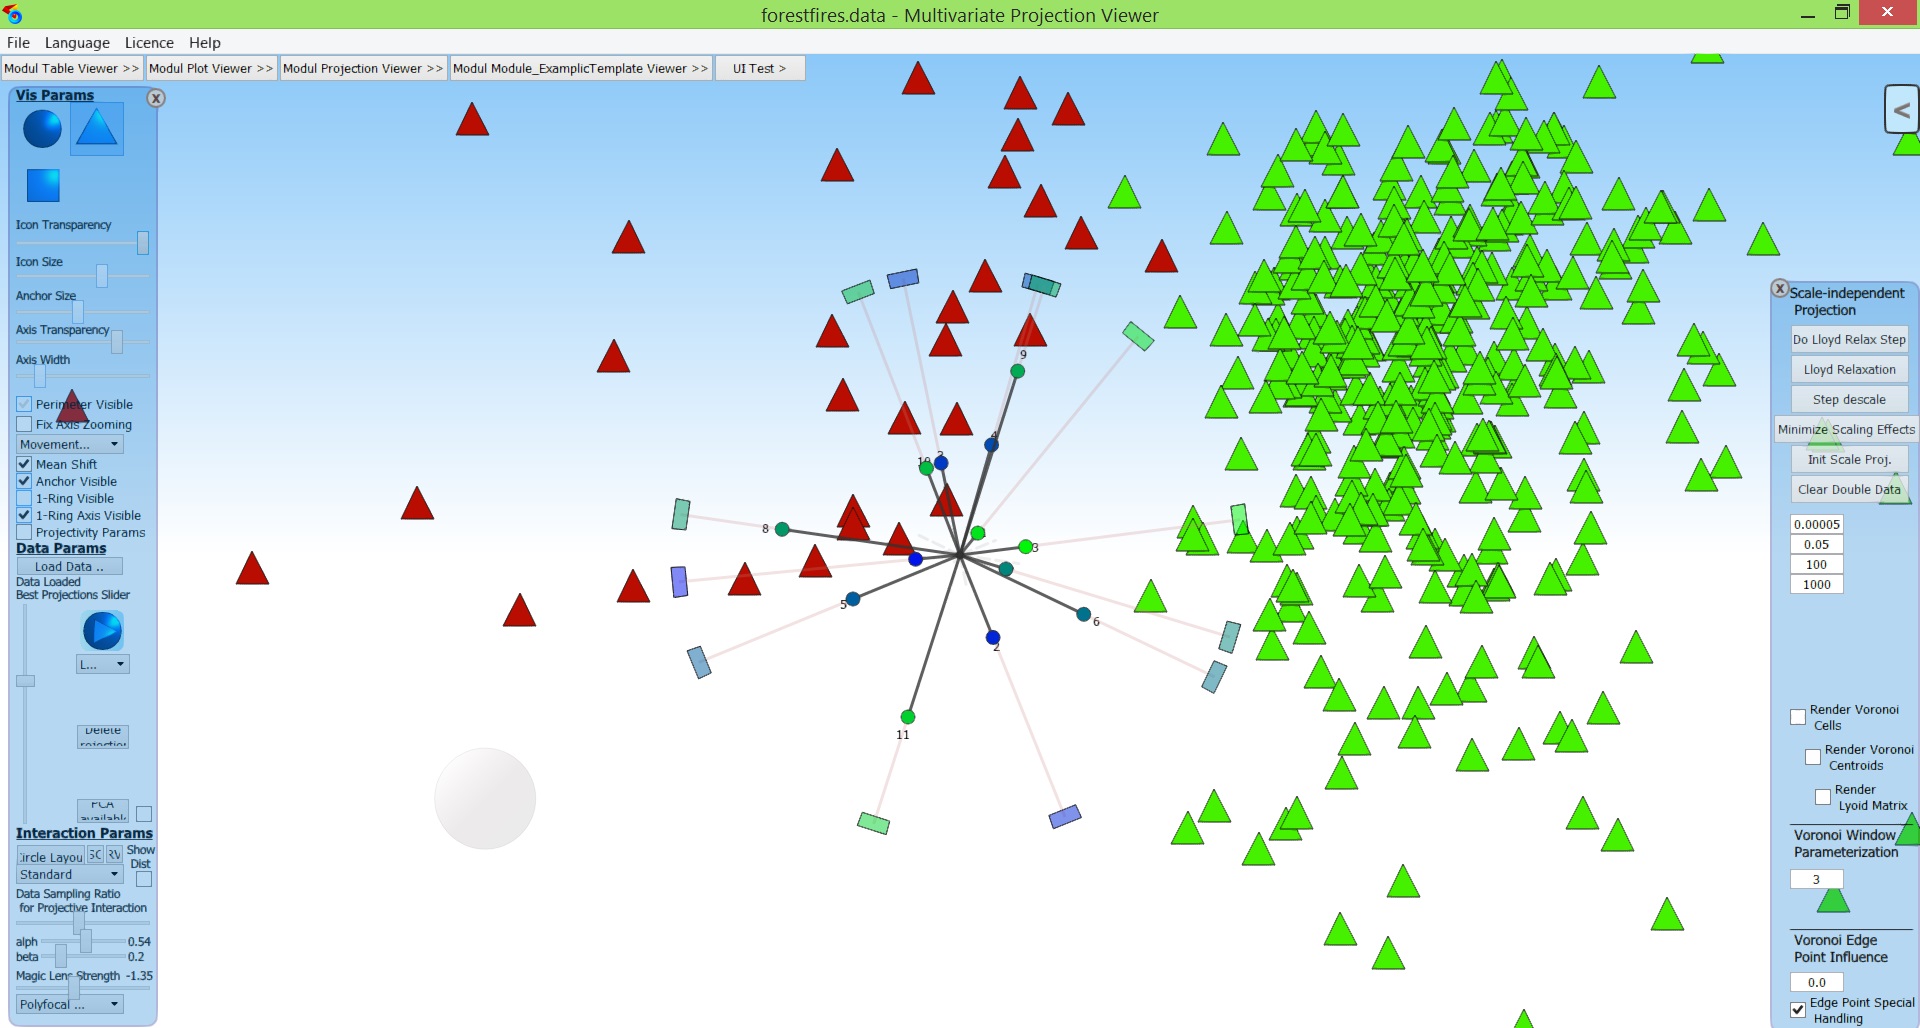
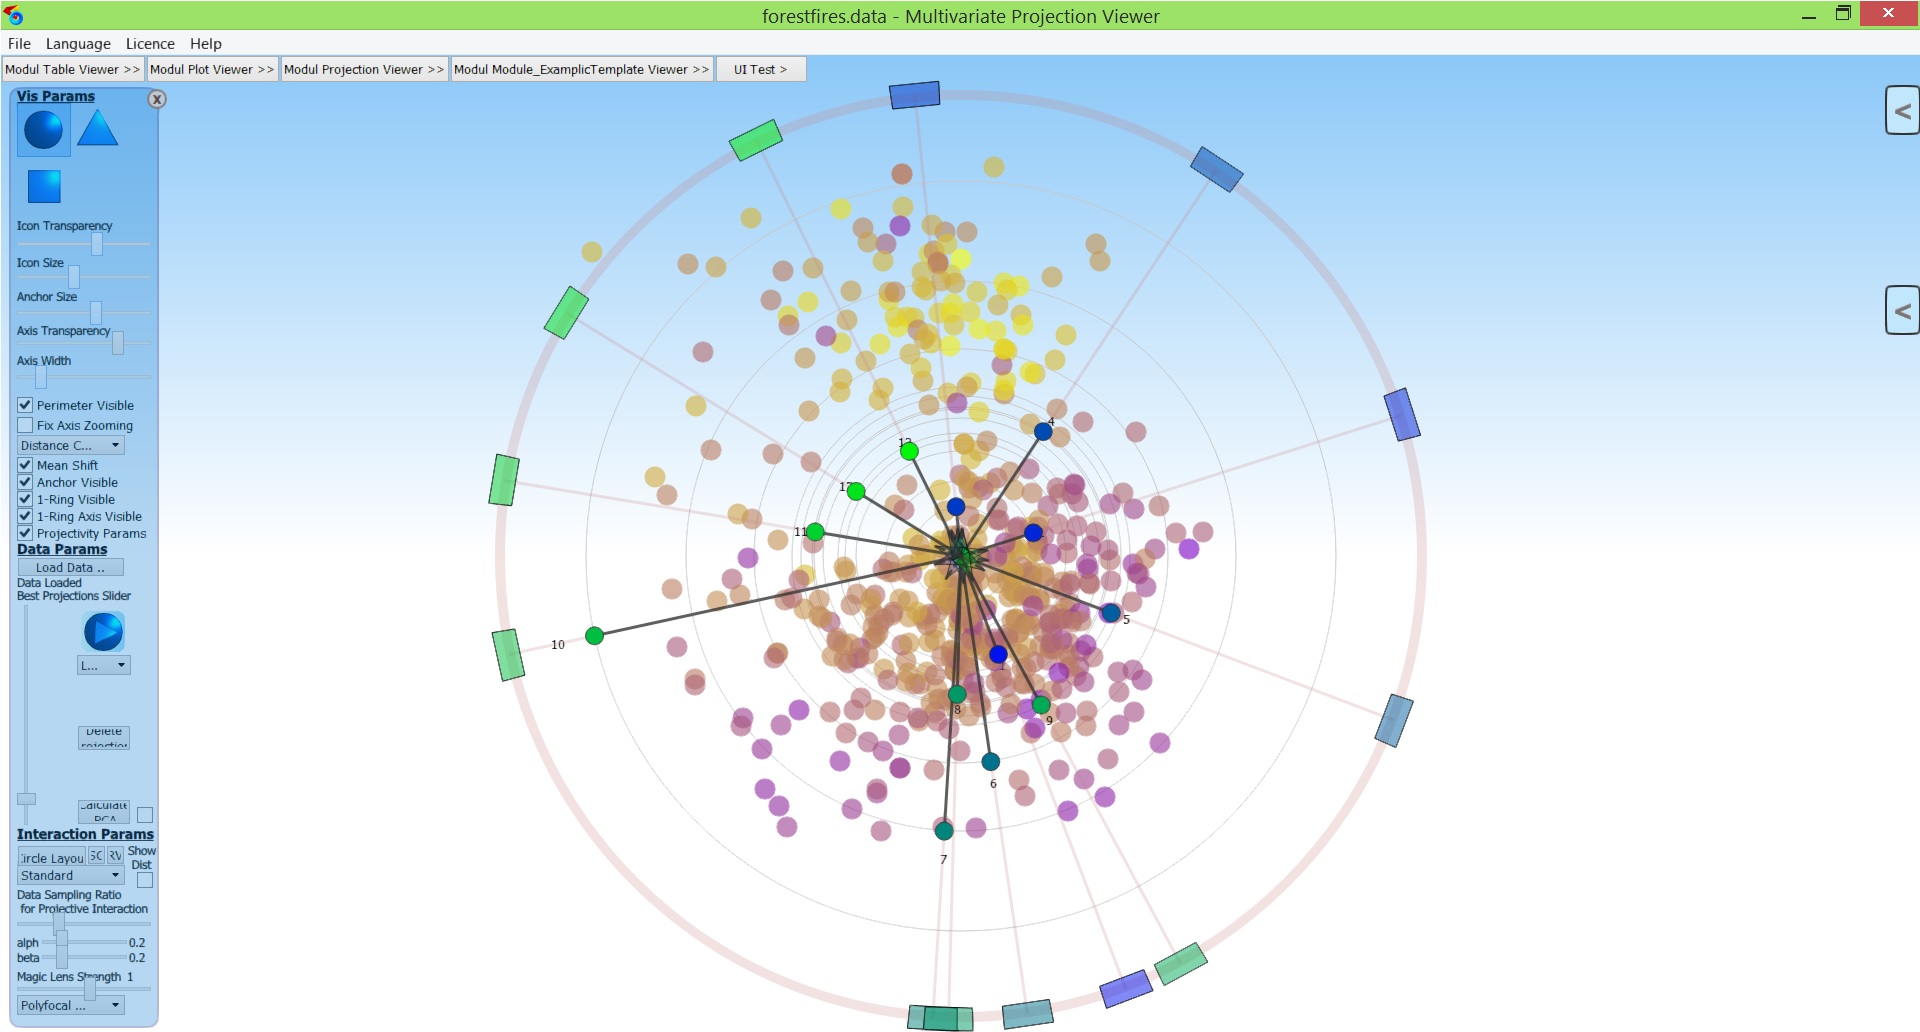
Our ProjectionViewer is a specialist tool for visual data analysis both for interested beginners and also for specific tasks for experts of data analysis. Our ProjectionViewer allows you to visually inspect your data using a variety of multivariate projections, like the Star Coordinates or Radial visualizations. In addition, it implements the Orthographic Star Coordinates, which minimize distortions during the projection process. In general, multivariate projections are projections which maps all columns (= dimensions) and all their data elements (= rows) of the complete data set at once. Thus, the data set is completely visualized and also relations in which several dimensions are involved are recognizable. Such relations are often referred to as multivariate relationships. Compared to the two-dimensional representations of the BivariateViewer, you can use our ProjectionViewer also to recognize multivariate correlations, which gives this module a strong value for the data analysis. From a technical point of view, it should be noted that: there is an infinite number of such projections, and it is unclear in advance, which of them need to be represented and which not (since all of them cannot be shown at once).
But our ProjectionViewer takes care in that regard: To help you to search through the projection space for interesting projections, our module offers a variety of methods: on the one hand, the manual exploration, in which the parameters (= axes) of the projection can be interactively set via graphical parameter methaphors. The second method is the concept of general projective maps, in which the schemes of the Star coordinates and the Radial Visualizations are combined. The third and strongest method is to precalculate an optimized amount of good projections (= Optimal Set of Projections). This will take a few seconds, but after that you can go through the set with a simple slider interaction to see all interesting projections one by one. This set will also show both all relevant global structures of the data and all relevant outliers as well. You cannot get easier working with multivariate projections at all! For the top experts amongst you comes here an important hint: Of course we also offer PCA and MDS-eske configurations, and much more …
")
")
")
")
")
")
")
")
")
")
")
")
")
")
")
")
")
")
")
")
")
")
For one of our preferred application areas, namely the visual machine learning (i.e., the training of models for the classification, the clustering, or the regression by using visual methods), our ProjectionViewer provides tools for visual clustering: By using interactive visual methods, you can cluster your data by your own and you can store this clusterization. This will either generate test data for your machine learning test scenarios or generate a clustering, which is possibly semantically better than one found by automatic methods. Can this be true? Yes, indeed: Prof. Jon Kleinberg found out that a good measure does not exist for every semantically meaningful clustering with which one automatically can cluster the data (= Kleinberg’s Impossibility Theorem). Thus, since you know your domain and your data best, it might be better to manually achieve clustering results. We support you in that regard.
Overall, our ProjectionViewer is a very powerful tool for data analysis. To help you to quickly get able to efficiently use this tool, there are tutorial videos and case studies available to guide you to exploit the strengths of this module in short time.
Functions/Features, which our ProjectionViewer provides: