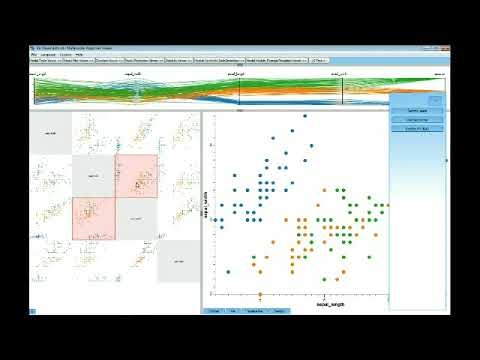
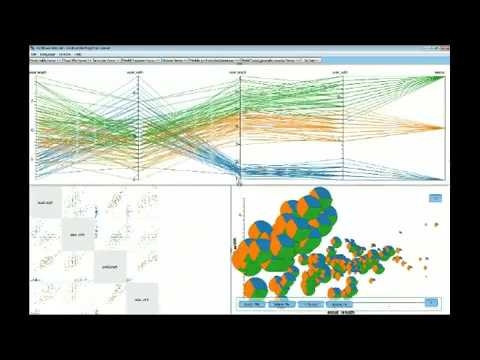
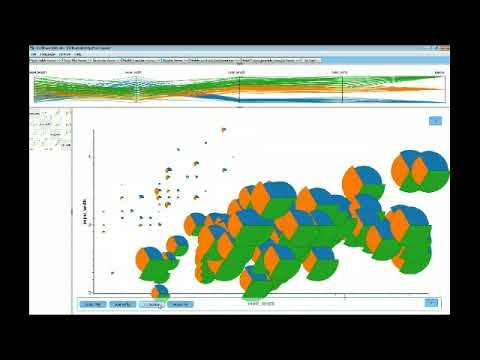
The BivariateViewer is a traditional tool for the visual data analysis. It supports the analysis of their data using (two-dimensional) interactive scatter coordinates, scatter plot matrices, parallel coordinates, and iconic representations. A toolbox of interactive lenses allows you to analyze your data in detail, to freely combine different views, to generate bivariate regressions (visual regression) and to visually test your models, or even consider density distributions to generate hypotheses about knowledge contained in your data. Simple, efficient, and simply efficient, the BivariateViewer is the optimal entry into visual data analysis.
Functions/Features, which our BivariateViewer provides:
BivariateViewer Image Gallery


