

-
 Projections
 -
 Icons
Icons -
 Charts
 -
Projections
LenIT Solutions

LenIT's Visual Sheet Explorer (VSE) Suite (Release 2.1)
The Visual Sheet Explorer is a powerful analysis tool and up-to-date the most popular product when it comes to (visual) data analysis of spreadsheet data.
LenIT's Visual Sheet Explorer (VSE) Suite (Release 2.1)
We present our Visual Sheet Explorer (VSE), Version 2.1.
The most popular international product for the (visual) analysis of table data/spreadsheets (multidimensional data).
The Visual Sheet Explorer allows you to analyze your spreadsheets, be it an Excel spreadsheet, a Google spreadsheet,
or any other spreadsheet.
For this, we use the CSV format internally:
this makes our analysis tool universal usable together with further
spreadsheet analysis tool. To make this easier for you, in all products of
the VSE family you have access to our integrated data set converter.
With this, you can exchange your data quickly and easily if needed.
For the analysis of your data, you have a variety of different modules within our module portfolio.
Each module enables either the solution of a special analysis task or a data manipulation task.
This gives you the freedom to choose exactly this module configuration that fits best to your needs.
Well, this way you spend your money only on what is most needed for your needs!
Currently, we offer 5 different modules to analysis of your spreadsheets:
 Modul 1 TableViewer:
 Modul 1 TableViewer:
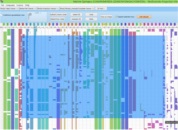
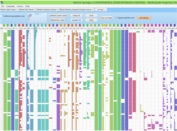
Description TableViewer:
The TableViewer allows you to visually analyze your tables/spreadsheets,
it allows to view rows and columns,
to sort and to perform data manipulations; to select, to rank and to mark data (which will affect other modules),
to generate graphical compressed views and it enables to save them instantly as a png-image (for example:
to be used in a presentation). With our interactive 2D Slider, we introduce another innovative tool that supports you
to find optimal parameters for an appropriate table presentation in an intuitive and playful way.
The TableViewer is our standard module, which will always be found in each configuration of our VSE toolbox family.
Modul 2 PlotViewer:
 Modul 2 PlotViewer:
Description PlotViewer:
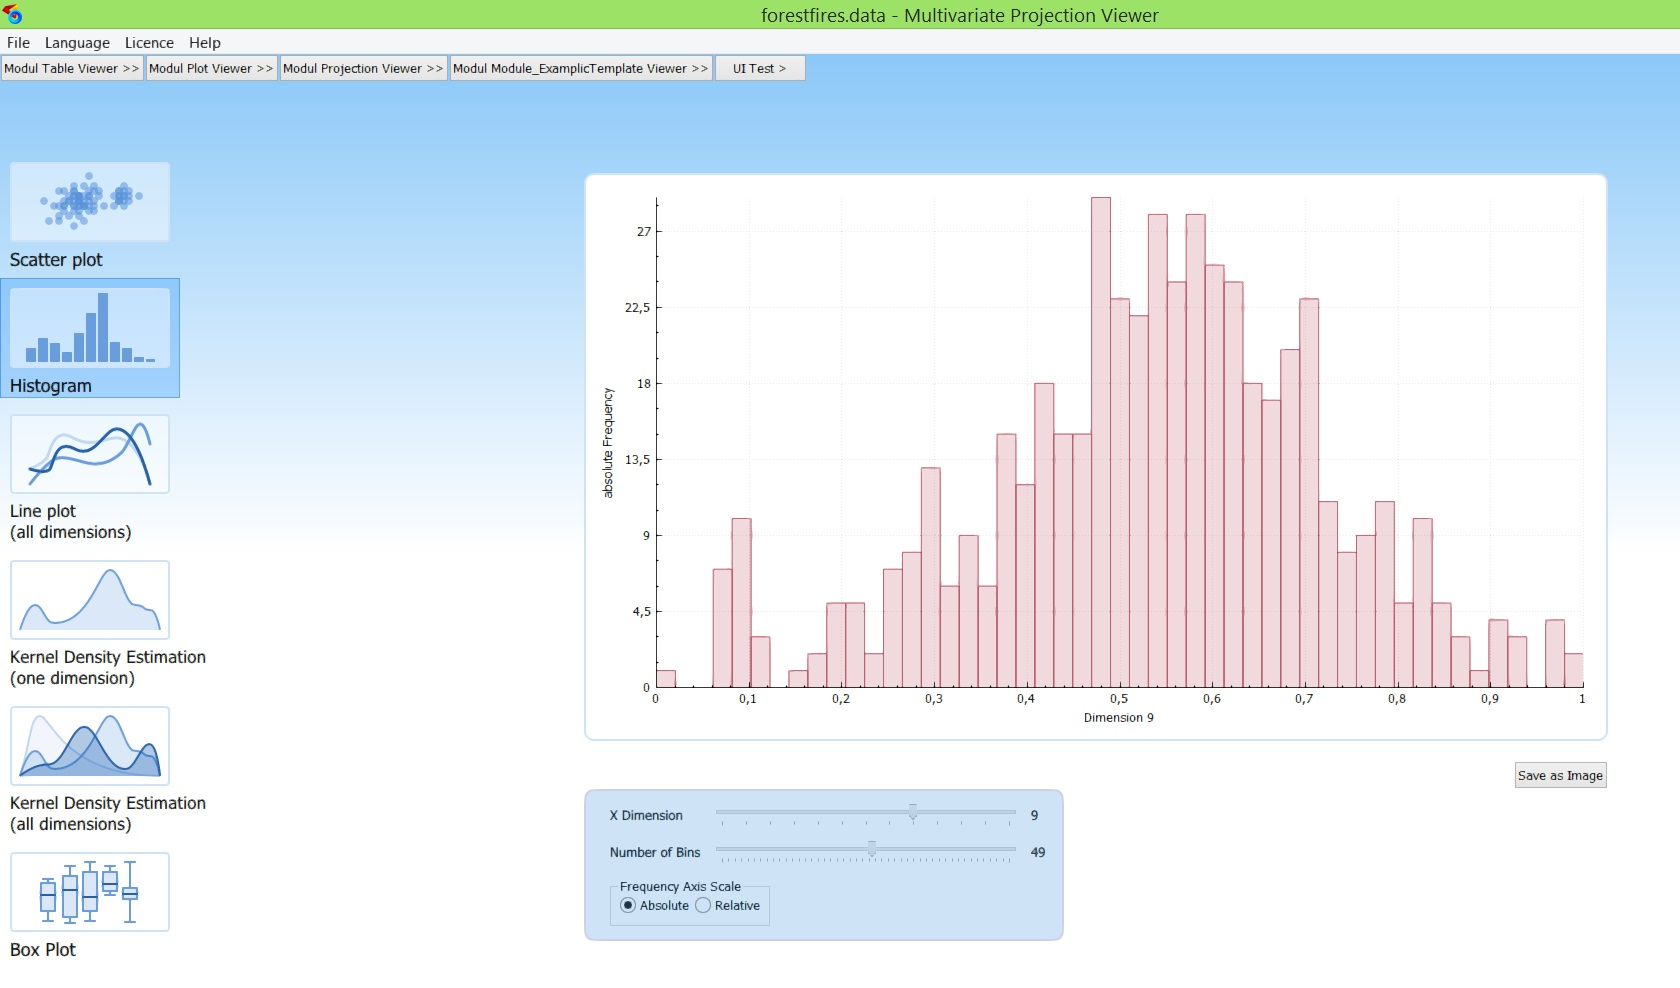
The PlotViewer of our VSESuite is a tool in order to quickly create different charts and diagrams
and to save them as a png-picture. Originally intended for customers who are looking for high-quality graphics of their data
need for presentations. Be it for talks at international conferences, the weekly group meeting, or the
semi-annual meeting with the Board.
Also because our company founders themselves often needed such graphics for presentations and scientific work,
they have started to develop this module and add it to our module portfolio.
Creating high-quality graphics from your data is no longer a problem with the ait of our PlotViewer!
Modul 3 BivariateViewer:

 Modul 3 BivariateViewer:
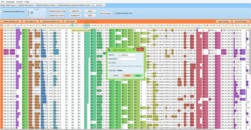
Description BivariateViewer:
The BivariateViewer is a traditional tool for the visual data analysis.
It supports the analysis of their data
using (two-dimensional) interactive scatter coordinates, scatter plot matrices, parallel coordinates, and
iconic representations. A toolbox of
interactive lenses allows you to analyze your data in detail, to freely combine different views,
to generate bivariate regressions (visual regression) and to visually test your models, or even
consider density distributions to generate hypotheses about knowledge contained in your data.
Simple, efficient, and simply efficient, the BivariateViewer is the optimal entry into visual data analysis.
Modul 4 ProjectionViewer:
 Modul 4 ProjectionViewer:
Description ProjectionViewer:
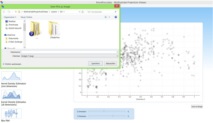
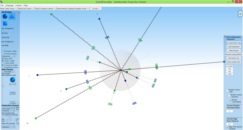
Our ProjectionViewer is a specialist tool for visual data analysis
both for interested beginners and also for specific tasks for experts of data analysis.
Our ProjectionViewer allows you to visually inspect your data using a variety of multivariate projections,
like the Star Coordinates or
Radial visualizations. In addition, it implements the Orthographic Star Coordinates, which
minimize distortions during the projection process. In general, multivariate projections are projections
which maps all columns (= dimensions) and all their data elements (= rows) of the complete data set at once.
Thus, the data set is completely visualized and also relations in which several
dimensions are involved are recognizable. Such relations are often referred to as multivariate relationships.
Compared to the two-dimensional representations of the BivariateViewer, you can use our
ProjectionViewer also to recognize multivariate correlations,
which gives this module a strong value
for the data analysis.
From a technical point of view, it should be noted that: there is an infinite number of such projections, and it is unclear
in advance,
which of them need to be represented and which not (since all of them cannot be shown at once).
But our ProjectionViewer takes care in that regard:
To help you to search through the projection space for interesting projections, our module offers a variety of methods:
on the one hand, the manual exploration, in which the parameters (= axes) of the projection
can be interactively set via graphical parameter methaphors.
The second method is the concept of general projective maps, in which the schemes of the Star coordinates and the
Radial Visualizations are combined. The third and strongest method
is to precalculate an optimized amount of good projections (= Optimal Set of Projections).
This will take a few seconds, but after that you can go through the set with a simple slider
interaction to see all interesting projections one by one.
This set will also show both all relevant global structures of the data and all relevant outliers as well. You cannot get easier
working with multivariate projections at all!
For the top experts amongst you comes here an important hint: Of course we also offer PCA and MDS-eske configurations, and much more ...
For one of our preferred application areas, namely the visual machine learning (i.e., the training of models
for the classification, the clustering,
or the regression by using visual methods), our ProjectionViewer provides tools for visual clustering:
By using interactive visual methods, you can cluster your data by your own and you can store this clusterization.
This will either generate test data for your machine learning test scenarios or generate a clustering,
which is possibly semantically better than one found by automatic methods. Can this be true?
Yes, indeed: Prof. Jon Kleinberg found out
that a good measure does not exist for every semantically meaningful clustering with which one automatically
can cluster the data (= Kleinberg's Impossibility Theorem). Thus, since you know your domain and your data
best, it might be better to manually achieve clustering results.
We support you in that regard.
Overall, our ProjectionViewer is a very powerful tool for data analysis.
To help you to quickly get able to efficiently use this tool,
there are tutorial videos and case studies available to guide you
to exploit the strengths of this module in short time.
Modul 5 StatisticViewer:
Modul 5 StatisticViewer:
Description StatisticViewer:
Our StatisticViewer is a statistical reporting tool.
The idea: We also want to make statistics available to non-statisticians!
For this, our tool generates a PDF report of the statistical
Properties of their data, such as correlations, significances, determine density functions, and much more.
In interactive text boxes, we also explain what statistical terms are meant for
have a qualitative meaning, so that they judge themselves to learn to separate the important and the unimportant.
In general, our StatisticViewer includes many areas of descriptive statistics or closing statistics.
What expenses
to be calculated, you determine via an intuitive and simple visual selection tool, which
Mainly working on checkboxes. About how to create statistics
you do not have to dispose of this work
the StatisticViewer. You can fully concentrate on the interpretation of these results,
And so they can discover the hidden knowledge that is in their data even faster and safer.
Are you a bit tired of small-scale work with SPSS, R, or something similar; then you will be our StatistikViewer
Love simplicity and functionality.
You can explore many more details of our modules here at Available Modules . There, you will also find exciting videos, which brings you closer to the different functions of our VSE. Enjoy exploring!
Our license concept:
You can choose from different licence types:
- Single Licenses or Cluster Licenses:
A single license permits to use a product on a single PC client.
A cluster license permits to use a product on a number of PC clients at once.
- Limited time:
Our licenses are available for either a one year period or a several year period.
For such period-based temporary licenses, a product can be used (after activation) for a certain period of time,
until this period will be expired. This gives you the opportunity
to then look back on our site and to participate in the latest developments of our VSESuite.
Internationality:
Unsere VSESuite 2.1 ist in jeder Version mehrsprachig, sowohl bezüglich aller
Texte als auch aller Videos.
Aktuell unterstützen wir die Sprachen Deutsch und Englisch.
Our VSESuite 2.1 is multilingual in every version, both in terms of all
texts and all videos. Currently, we support the languages German and English.
Our integrated video concept:
Almost every slider, button, and functionality have their own ToolTip, which links to a video:
It explains how the functionality works and what it means.
By making the ToolTip attached to each item, you
never lose the overview and you get exactly the explanations you need, just when you need them.
Our VSE Products:
Currently, we offer our modules in three different configurations:
The VSESuite 2.1 lite (from $ 19.99)
includes the TableViewer and the PlotViewer ,
the VSESuite 2.1 base (from 39.99 €)
includes the TableViewer , the PlotViewer , and the BivariateViewer ,
the VSESuite 2.1 pro (from $ 79.99) includes the
TableViewer , the PlotViewer , the
BivariateViewer , the ProjectioneViewer and the StatisticViewer .
Installation:
Just click on the links to our online shops at the VSE product of your choice:
Follow the descriptions there; do not worry, the purchase will take 3 min, or less.
After purchasing our tool, you will receive an installer program, for download. Execute it,
in order to install the product VSESuite 2.1 .
Then, under 'License' click on 'Activate' to activate your version for the use
(you need an online connection for it). Then your version of can be used according to the license.
Purchase your version of the Visual Sheet Explorer today,
and start to analyze your data intuitively and easily.
LenIT - really understand data!


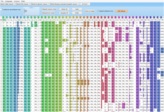
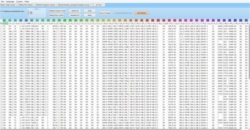
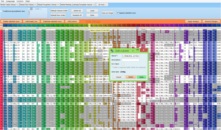
Description TableViewer:
The TableViewer allows you to visually analyze your tables/spreadsheets, it allows to view rows and columns, to sort and to perform data manipulations; to select, to rank and to mark data (which will affect other modules), to generate graphical compressed views and it enables to save them instantly as a png-image (for example: to be used in a presentation). With our interactive 2D Slider, we introduce another innovative tool that supports you to find optimal parameters for an appropriate table presentation in an intuitive and playful way. The TableViewer is our standard module, which will always be found in each configuration of our VSE toolbox family.
Functions/Features, which our TableViewer provides:
>Since Release 1.5 (and forever)
- Interactive Sheet View
- View to Index and Header
- Sort Columns (ascending, descending)
- Interactively mark Rows, Cells, and und Columns
>Since Release 1.9
- View as a graphical-compressed table
- Switch between traditional table view and graphical-compressed table (engl. Traditional Spreedsheet View)
- 2D Slider for choosing height and width of the table intuitively
- Columns can be shifted and alligned verticalley (affects further modules)
- Undo / Redo function for interactive markings
- Reset the order and sorting back to the original state for rows and columns
>Since Release 2.1
- Activate / deactivate individual columns (affects other modules)
- Edit table headers, such as column names and data types (engl. Edit dataset)
- Immediately move columns to the 1st position (from left)
(small arrow in the table header, move to left)
- Select any columns as classes within a session (via press small c at the top of the column; this allows different labels to be tested)
- Select all / deselect all function
- Save a graphic-compressed table as an image (engl. Save as Image)
- Tables Lens: Enlarge marked cells so that data (numbers and text) of them are visible (engl. expand selected rows)
trtrj ht rhrth rthr trthr ttrh rhr rthtrhtr tr hthrh th rth h htr htrh trt ht rht rt
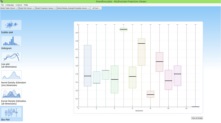
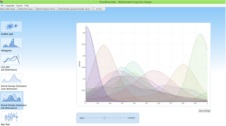
Description PlotViewer:
The PlotViewer of our VSESuite is a tool in order to quickly create different charts and diagrams and to save them as a png-picture. Originally intended for customers who are looking for high-quality graphics of their data need for presentations. Be it for talks at international conferences, the weekly group meeting, or the semi-annual meeting with the Board. Also because our company founders themselves often needed such graphics for presentations and scientific work, they have started to develop this module and add it to our module portfolio. Creating high-quality graphics from your data is no longer a problem with the ait of our PlotViewer!
Functions/Features, which our PlotViewer provides:
>Since Release 1.9
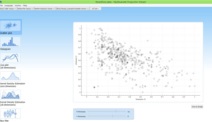
- Representation of scatter plots of each dimension (column)
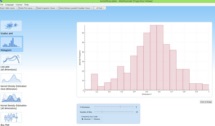
- Representation of histograms of each dimension (column) with absolute and relative (frequency) view to the Axes and parametrizable numbe of bins.
- Representation of statistical properties of all data as box plot
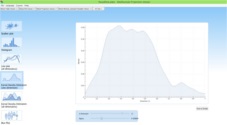
- Display of all data as line plot
>Since Release 2.1
- Display of dimensions (columns) as Kernel Density Estimation with parameterizable variances
- Representation of all dimensions (columns) as Kernel Density Estimation with parametric variances
- Saving arbitrary visualizations as Images on the Hard Disk (Save as Image)
Description StatisticViewer:
Our StatisticViewer is a statistical reporting tool. The idea: We also want to make statistics available to non-statisticians! For this, our tool generates a PDF report of the statistical Properties of their data, such as correlations, significances, determine density functions, and much more. In interactive text boxes, we also explain what statistical terms are meant for have a qualitative meaning, so that they judge themselves to learn to separate the important and the unimportant. In general, our StatisticViewer includes many areas of descriptive statistics or closing statistics.
What expenses to be calculated, you determine via an intuitive and simple visual selection tool, which Mainly working on checkboxes. About how to create statistics you do not have to dispose of this work the StatisticViewer. You can fully concentrate on the interpretation of these results, And so they can discover the hidden knowledge that is in their data even faster and safer. Are you a bit tired of small-scale work with SPSS, R, or something similar; then you will be our StatistikViewer Love simplicity and functionality.
Functions/Features, which our StatisticViewer provides:
>Since Release 1.9
- User interface for creating reporting
- International descriptions of the technical characteristics of the individual features in the reporting
- Document Generation
>Since Release 2.1
- Mean values (Mean, Media, Geometric)
- Variances and Skewness
- Distribution tests
- Significance test (ANNOVA such as T-test, F-test, Welch test, etc.).
- Correlation tests (Pearson, Spearman).
- Univariate and multivariate regression (linear and nonlinear via Box-Cox transformation)
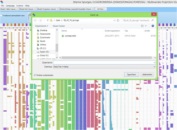
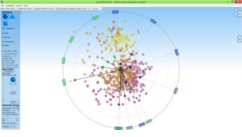
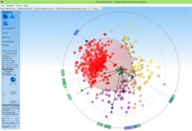
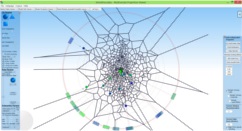
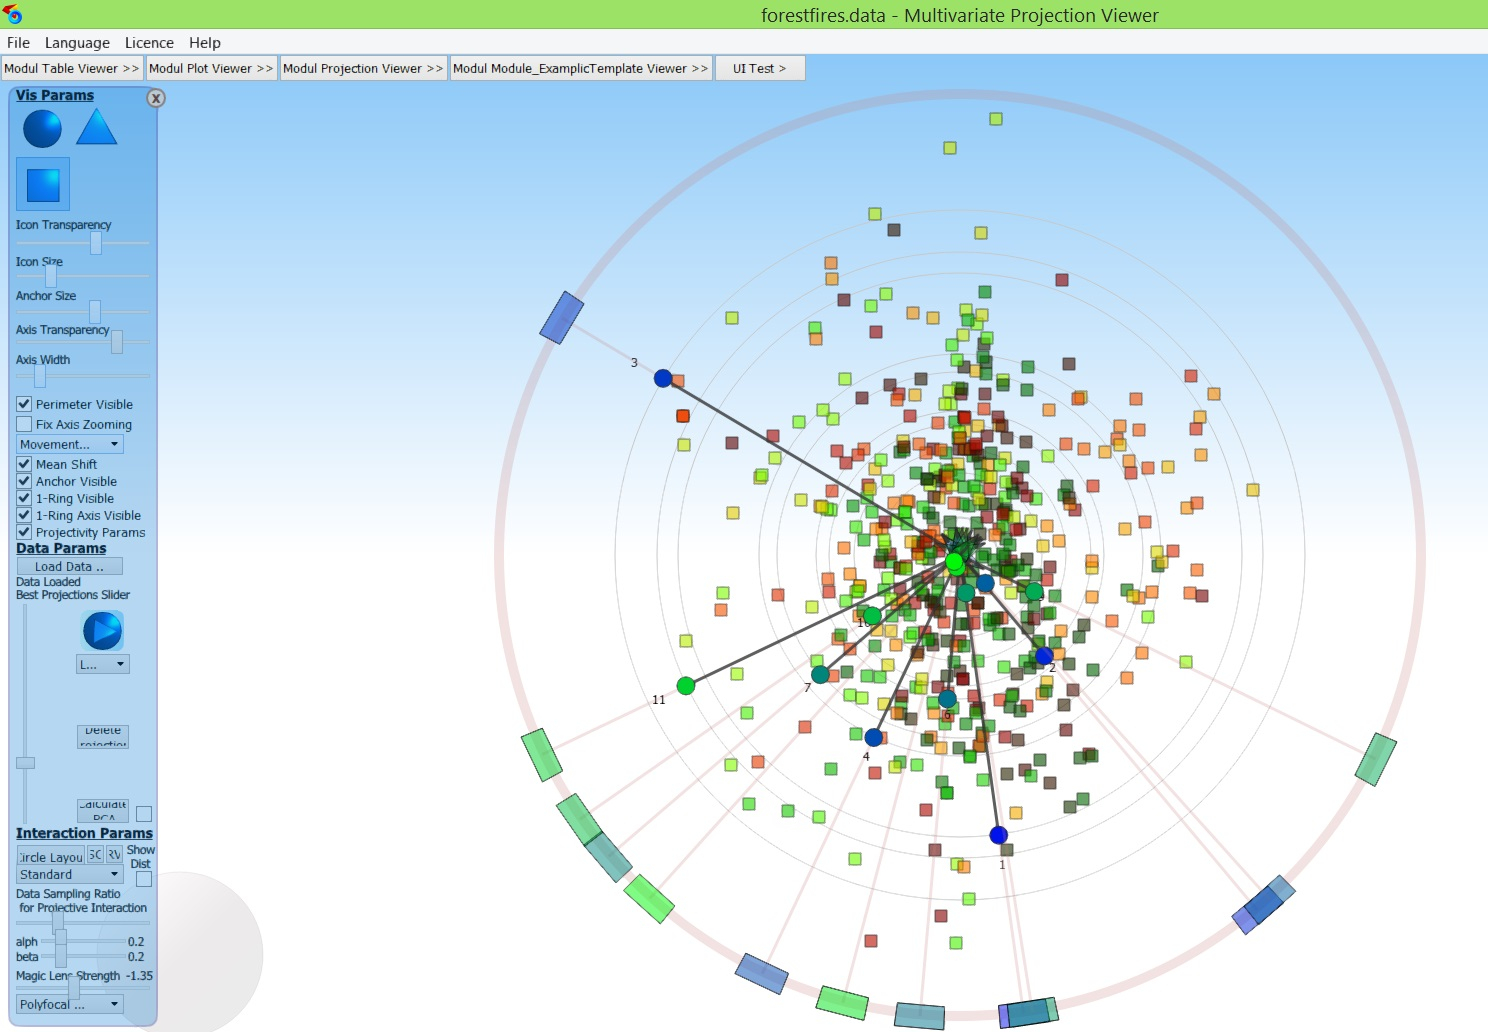
Description ProjectionViewer:
Our ProjectionViewer is a specialist tool for visual data analysis both for interested beginners and also for specific tasks for experts of data analysis. Our ProjectionViewer allows you to visually inspect your data using a variety of multivariate projections, like the Star Coordinates or Radial visualizations. In addition, it implements the Orthographic Star Coordinates, which minimize distortions during the projection process. In general, multivariate projections are projections which maps all columns (= dimensions) and all their data elements (= rows) of the complete data set at once. Thus, the data set is completely visualized and also relations in which several dimensions are involved are recognizable. Such relations are often referred to as multivariate relationships. Compared to the two-dimensional representations of the BivariateViewer, you can use our ProjectionViewer also to recognize multivariate correlations, which gives this module a strong value for the data analysis. From a technical point of view, it should be noted that: there is an infinite number of such projections, and it is unclear in advance, which of them need to be represented and which not (since all of them cannot be shown at once).
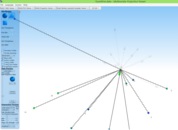
But our ProjectionViewer takes care in that regard: To help you to search through the projection space for interesting projections, our module offers a variety of methods: on the one hand, the manual exploration, in which the parameters (= axes) of the projection can be interactively set via graphical parameter methaphors. The second method is the concept of general projective maps, in which the schemes of the Star coordinates and the Radial Visualizations are combined. The third and strongest method is to precalculate an optimized amount of good projections (= Optimal Set of Projections). This will take a few seconds, but after that you can go through the set with a simple slider interaction to see all interesting projections one by one. This set will also show both all relevant global structures of the data and all relevant outliers as well. You cannot get easier working with multivariate projections at all! For the top experts amongst you comes here an important hint: Of course we also offer PCA and MDS-eske configurations, and much more ...
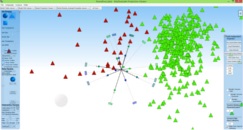
For one of our preferred application areas, namely the visual machine learning (i.e., the training of models for the classification, the clustering, or the regression by using visual methods), our ProjectionViewer provides tools for visual clustering: By using interactive visual methods, you can cluster your data by your own and you can store this clusterization. This will either generate test data for your machine learning test scenarios or generate a clustering, which is possibly semantically better than one found by automatic methods. Can this be true? Yes, indeed: Prof. Jon Kleinberg found out that a good measure does not exist for every semantically meaningful clustering with which one automatically can cluster the data (= Kleinberg's Impossibility Theorem). Thus, since you know your domain and your data best, it might be better to manually achieve clustering results. We support you in that regard.
Overall, our ProjectionViewer is a very powerful tool for data analysis. To help you to quickly get able to efficiently use this tool, there are tutorial videos and case studies available to guide you to exploit the strengths of this module in short time.
Functions/Features, which our ProjectionViewer provides:
>Since Release 1.5
- Visualization of the projection matrix (axes, anchor points, axis aligners and projective coefficients)
- Star Coordinates (= linear multivariate projection)
- Radial Visualization (= non-linear multivariate projections)
- Projective maps (= the space of projective and non-projective projections can be explored by the use of our triangular projective coefficients)
- Orthographic Star Coordinates (= minimizes distance distortions in the projection by automatic adjustment of the axes)
>Since Release 1.9
- Manual exploration through interaction with the anchor points, axes, and axis aligners.
- Stepwise or animated exploration of precomputed sets of interesting projections (Optimal Set of Projections, PCA, etc.)
- Projective Minimal Distance Error-based projections (= minimizes distance distortions in the projection by suitable adaptation of the projective coefficients)
- Polyfocal visual lenses
- Projective visual lenses
- Zoom and navigation functions for the projection
- OpenGL support for rendering the projected data points.
- Adjust transparency, size, visibility of visual elements as needed.
- Different icons for the representation of processed data points
- Coloring of the visualized projected data points with regard to specific properties (such as distance in the dataspace, the direction of the movements under axes interaction, etc.)
- Visual clustering: interactive clustering of data elements to clusters by selecting them using primitives (boxes, circles)
>Since Release 2.1
- Voronoi cell representation of the projected data points.
- direct interaction with the data points (English: Composition Operators), allowing of individual data items to interactively look for their projection properties.
- Adding freehand selection to our visual clustering concept
- Norm view: mapping the distances of the data in the original space to the radius of the projected points, so the cluster in the high-dimensional space can easier be seen in the projection (i.e., a set of small elements are pot. a cluste as well as a set of large ones too, etc.) - Save interactively created clusters as an additional dimension (column) of the data space for further use later on.
Description BivariateViewer:
The BivariateViewer is a traditional tool for the visual data analysis. It supports the analysis of their data using (two-dimensional) interactive scatter coordinates, scatter plot matrices, parallel coordinates, and iconic representations. A toolbox of interactive lenses allows you to analyze your data in detail, to freely combine different views, to generate bivariate regressions (visual regression) and to visually test your models, or even consider density distributions to generate hypotheses about knowledge contained in your data. Simple, efficient, and simply efficient, the BivariateViewer is the optimal entry into visual data analysis.
Functions/Features, which our BivariateViewer provides:
>Since Release 1.9
- Integrate our in-house Visualization Factory API to calculate Information Visualization textures.
- Multithreading Calculation of all visual textures
- Interactive view on parallel coordinates
- Progressive scatterplot matrix view (tiling, lazy loading, detailed layers on demand). to choose interesting views
>Since Release 2.1
- Integrate our detail view for selected textures
- incorporating our lens concept for textures
- Global switching of different views to the detail view: Density Plot View, PieChart Plot View, Inverse PieChat Plot View, Density-based Parallel Coordinates View
- Concept for visual local lenses to freely combine locally different views in the detail view. - Add our local lens: Density-based lens. - Add our local lens: PieChart-Plot lens and inverse PieChart-Plot lens. - adding our local lens: class view lenses (to represent different classes) - adding our local lens: regression lens (to calculate regression models of their data, using interactive visual methods)
- TableViewer
- PlotViewer
Buy VSE Suite Lite Licences:

CPU: at least 1 GHz
OS: Windows/Linux not older than als 2014 RAM: min. 2 GB
Speicher: min. 100 MB available
Grafik: 2 GB, min. OpenGL2.0
- TableViewer
- PlotViewer
- BibariateViewer
Buy VSE Suite Base Licences:
CPU: at least 1 GHz
OS: Windows/Linux not older than als 2014 RAM: min. 2 GB
Speicher: min. 100 MB available
Grafik: 2 GB, min. OpenGL2.0
- TableViewer
- PlotViewer
- BibariateViewer
- ProjectionViewer
- StatisticViewer
Buy VSE Suite Pro Licences:
CPU: at least 1 GHz
OS: Windows/Linux not older than als 2014 RAM: min. 2 GB
Speicher: min. 100 MB available
Grafik: 2 GB, min. OpenGL2.0
|
LenIT's
VSE
Suite
BASE
|
LenIT's
VSE
Suite
PRO
|
||||
|---|---|---|---|---|---|
| AVAILABLE MODULES: | 2 modules | 3 modules | 5 modules | ||
|
VSE
TABLE
Viewer
|
|
|
|
||
|
VSE
PLOT
Viewer
|
|
|
|
||
|
VSE
BIVARIANTE
Viewer
|
|
|
|||
|
VSE
PROJECTION
Viewer
|
|
||||
|
VSE
STATISTIC
Viewer
|
|
||||